SEO KPIs are metrics that are tied to a goal. For example, organic conversion rate is a KPI because it tells you whether your organic traffic is turning into customers. Page views alone? That is just a metric.
Here is a simple way to think about it: imagine you are on a road trip. SEO metrics are your mile markers they tell you how far you have come. SEO KPIs are your destination. You need both, but reaching the destination is what actually matters.
Leading vs. Lagging Indicators
SEO KPIs fall into two types:
- Leading indicators: metrics that show early progress, like keyword rankings, impressions, and organic traffic. These signal whether you are on the right track.
- Lagging indicators: the real business outcomes, like leads, sales, and revenue from organic. These take longer to move but confirm actual success.
Strong leading indicators done consistently over time tend to produce strong lagging indicators. Track both.
How Many SEO KPIs Should You Track?
The answer most SEO professionals agree on: 5 to 7 core KPIs. Any more than that and you risk analysis paralysis spending more time reading dashboards than actually improving your site.
How to Choose the Right SEO KPIs for Your Business
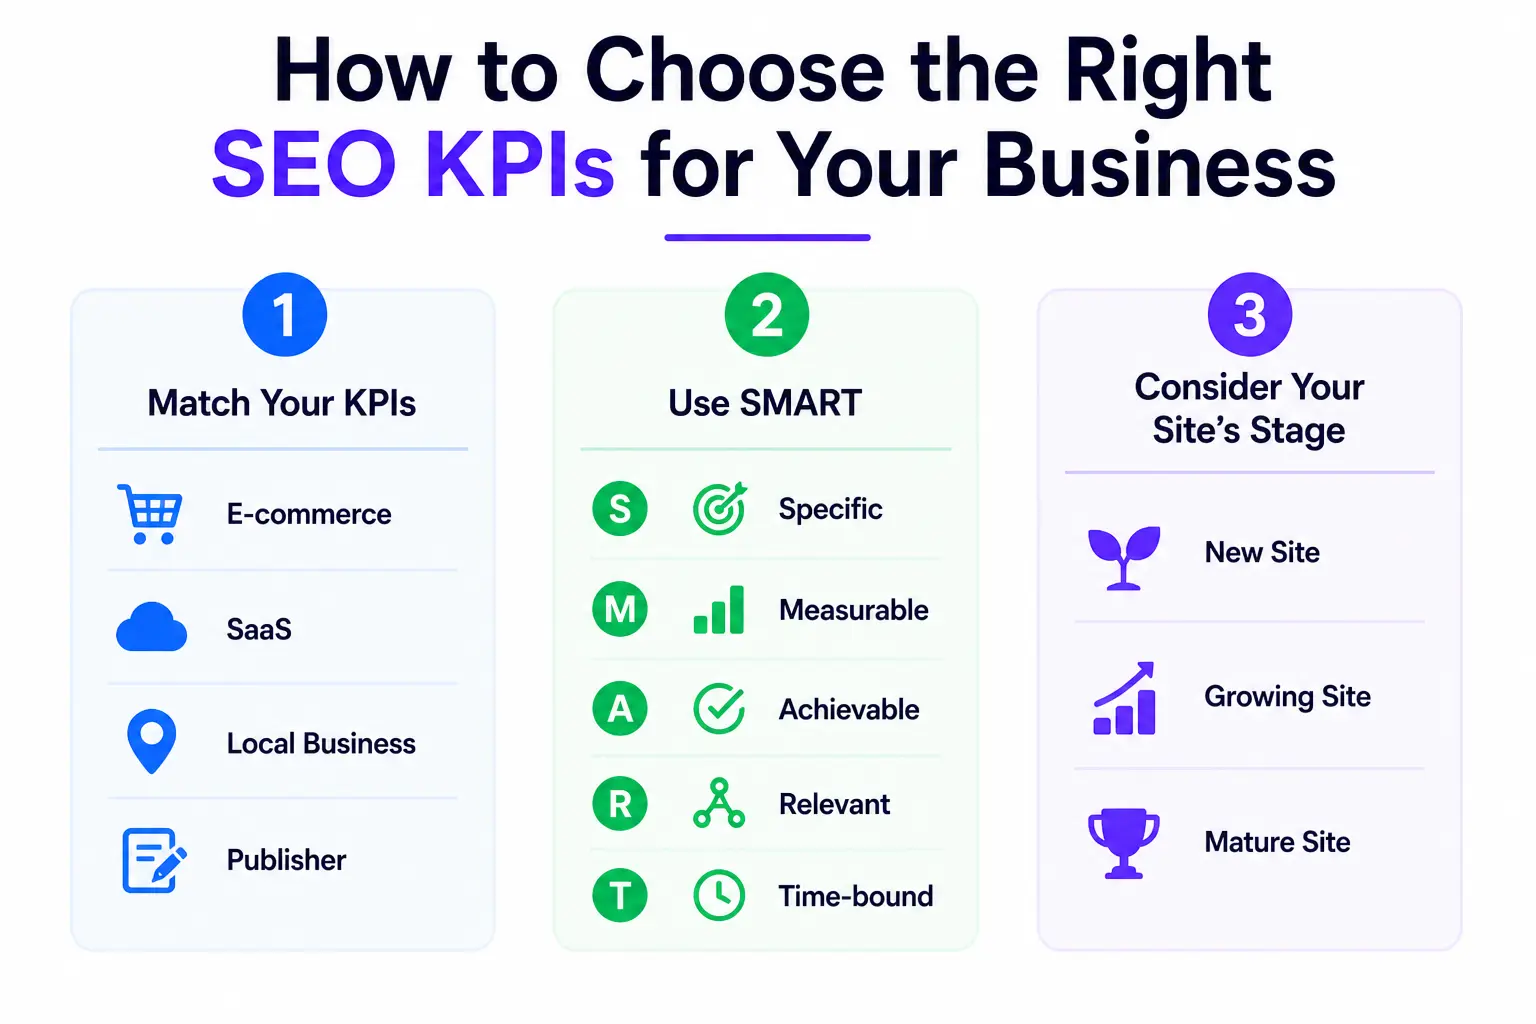
There is no single list of SEO KPIs that works for every business. The right ones depend on your goals, your industry, and where your site is in its growth.
Match Your KPIs to Your Business Type
- E-commerce: organic revenue, conversion rate, product page rankings, cart abandonment from organic traffic
- B2B SaaS: non-branded organic traffic, demo/trial signups, content-assisted deals, cost per acquisition
- Local business: Google Business Profile visibility, local keyword rankings, direction requests, call clicks
- Blog/media: organic traffic, engagement rate, email signups, returning visitors
Use the SMART Framework to Set Targets
Every KPI should be SMART: Specific, Measurable, Achievable, Relevant, and Time-bound. Instead of saying ‘I want more organic traffic,’ say: ‘I want to increase non-branded organic traffic by 20% over the next 90 days by publishing 8 optimised blog posts.’
That is a KPI you can act on and measure.
Consider Your Site’s Stage
- New site (0–6 months): Focus on indexed pages, impressions, and crawl health. Conversions can wait until you have traffic.
- Growing site (6–18 months): Shift focus to keyword rankings, CTR, and organic traffic growth.
- Established site (18+ months): Prioritise conversion rate, revenue from organic, and domain authority trends.
The 15 Most Important SEO KPIs to Track in 2026
Below are 15 SEO KPIs organised into four categories. For each one, you will find what it is, why it matters, how to track it, and a benchmark to aim for.
Visibility KPIs
| KPI 1: Organic Traffic | |
| What it is | The number of visitors who land on your site through unpaid search results. |
| Why it matters | It is the most direct output of your SEO work. More visibility in search = more organic visitors. |
| How to track | GA4 → Reports → Acquisition → Traffic acquisition → Filter by ‘Organic Search’ |
| Benchmark | Healthy sites see 50–70% of total traffic from organic. Aim for 5–10% month-over-month growth. |
| Pro tip | Segment by branded vs. non-branded. Growth in non-branded traffic is a stronger SEO signal. |
| KPI 2: Keyword Rankings | |
| What it is | Where your pages appear in Google search results for your target keywords. |
| Why it matters | Rankings drive traffic — position 1 gets ~27.6% of clicks, position 2 gets ~15.8%, position 3 gets ~11%. |
| How to track | Ahrefs Rank Tracker, Semrush Position Tracking, or Google Search Console (average position) |
| Benchmark | Track position for 20–50 high-value target keywords. Aim for page 1 visibility within 6 months. |
| Pro tip | Do not chase every keyword. Focus on the ones that drive qualified traffic and conversions. |
| KPI 3: Impressions | |
| What it is | How many times your pages appeared in Google search results, whether clicked or not. |
| Why it matters | High impressions with low CTR means your titles and meta descriptions need work. It is a visibility signal before the click. |
| How to track | Google Search Console → Performance → Total impressions |
| Benchmark | Growing impressions month-over-month is a positive sign, especially for new content. |
| Pro tip | Pair impressions with CTR. Low CTR on high-impression pages is a quick-win optimisation opportunity. |
| KPI 4: AI Overview / AI Citation Visibility | |
| What it is | How often your brand or content is cited inside AI-generated answers (Google AI Overviews, ChatGPT, Perplexity). |
| Why it matters | In 2026, AI answers often replace traditional search results. If your content is not cited, you are invisible — even if you rank well. |
| How to track | Prompt-based monitoring tools, brand mention trackers. Cross-reference with Search Console query data. |
| Benchmark | Tracking this as a trend is more useful than absolute numbers. Aim to appear in AI answers for your top 10–20 target queries. |
| Pro tip | Content that is clear, authoritative, well-structured, and cites credible sources tends to get picked up by AI systems. |
| KPI 5: Branded vs. Non-Branded Traffic Split | |
| What it is | The ratio of visitors searching for your brand name vs. visitors finding you through generic topic searches. |
| Why it matters | Branded spikes from PR campaigns can mask flat organic growth. Non-branded growth is pure SEO performance. |
| How to track | Search Console → Filter queries → Exclude brand name variations |
| Benchmark | For most sites, 60–70% non-branded traffic indicates healthy SEO reach. |
| Pro tip | If branded traffic is consistently rising but non-branded is flat, your content strategy needs attention. |
Engagement KPIs
| KPI 6: Click-Through Rate (CTR) | |
| What it is | The percentage of users who click your listing after seeing it in search results. |
| Why it matters | CTR is the bridge between visibility and traffic. A low CTR on a high-ranking page means your title or meta description is not compelling enough. |
| How to track | Google Search Console → Performance → CTR column (not third-party estimated CTR curves) |
| Benchmark | Position 1: ~27.6% | Position 2: ~15.8% | Position 3: ~11.0% (Backlinko, 2026) |
| Pro tip | Pages with impressions above 1,000 but CTR below 2% are your fastest-win optimisation targets. |
| KPI 7: Engagement Rate (GA4) | |
| What it is | The percentage of sessions that are ‘engaged’ — meaning the user spent 10+ seconds on site, viewed 2+ pages, or completed a conversion event. |
| Why it matters | GA4 replaced bounce rate with engagement rate. It is a better measure of whether users found what they were looking for. |
| How to track | GA4 → Reports → Engagement → Pages and screens |
| Benchmark | 55%+ for blog pages, 70%+ for landing pages, 80%+ for product pages. |
| Pro tip | Low engagement rate on a high-traffic page usually signals a content-intent mismatch. The page is ranking for the wrong query. |
| KPI 8: Average Session Duration / Pages Per Session | |
| What it is | How long users spend on your site and how many pages they visit in one session. |
| Why it matters | These engagement signals tell Google that users found your content valuable — which positively influences future rankings. |
| How to track | GA4 → Reports → Acquisition → Traffic acquisition → Average engagement time per session |
| Benchmark | 2+ minutes average session duration and 2+ pages per session are healthy signs. |
| Pro tip | Internal linking is one of the fastest ways to improve pages-per-session and reduce drop-offs. |
| KPI 9: Core Web Vitals (LCP, INP, CLS) | |
| What it is | Google’s three user experience metrics: Largest Contentful Paint (page load speed), Interaction to Next Paint (responsiveness), and Cumulative Layout Shift (visual stability). |
| Why it matters | Google uses Core Web Vitals as a ranking signal. More importantly, poor vitals hurt conversions — even when rankings are fine. |
| How to track | Google PageSpeed Insights, Search Console → Core Web Vitals report |
| Benchmark | LCP < 2.5 seconds, INP < 200ms, CLS < 0.1 — all in the ‘Good’ range per Google’s thresholds. |
| Pro tip | Core Web Vitals impact conversions more than rankings alone. Fix them even if you are not seeing a ranking drop. |
Authority & Technical KPIs
| KPI 10: Domain Authority / Domain Rating | |
| What it is | A third-party score (Moz’s DA, Ahrefs’ DR, Semrush’s AS) that estimates how well your domain could rank based on its backlink profile. |
| Why it matters | It is a useful trend indicator. A rising DR/DA over time signals that your link-building efforts are working. |
| How to track | Ahrefs Site Explorer (Domain Rating), Moz Link Explorer (Domain Authority), Semrush (Authority Score) |
| Benchmark | A gain of 3–5 points per year is solid for a mid-sized site. Compare against direct competitors, not the whole internet. |
| Pro tip | Never use DA/DR as an absolute number. It is only meaningful relative to your competitors and your own historical trend. |
| KPI 11: Referring Domains | |
| What it is | The count of unique websites linking to your domain (distinct from total backlink count). |
| Why it matters | 50 links from one spammy site is far less valuable than 50 links from 50 different authoritative sites. Referring domains is the metric that actually matters. |
| How to track | Ahrefs → Referring domains report | Semrush → Backlink Analytics → Referring domains |
| Benchmark | 5–15 new referring domains per month from outreach and digital PR is healthy for most mid-sized sites. |
| Pro tip | Track net growth (new vs. lost referring domains). Losing domains fast can indicate a backlink quality problem. |
| KPI 12: Indexed Pages | |
| What it is | The number of your pages that Google has crawled and included in its search index. |
| Why it matters | Pages that are not indexed cannot rank. This is your most fundamental technical SEO check. |
| How to track | Google Search Console → Index → Pages report. Check both ‘Indexed’ and ‘Not indexed’ tabs. |
| Benchmark | All important pages should be indexed. A large number of ‘not indexed’ pages signals crawl or content quality issues. |
| Pro tip | Run a monthly audit. Do not over-interpret single alerts cross-check crawl data with impressions data to separate noise from signal. |
Conversion & Revenue KPIs
| KPI 13: Organic Conversion Rate | |
| What it is | The percentage of organic visitors who complete a goal a purchase, form submission, free trial signup, or phone call. |
| Why it matters | Rankings without conversions are vanity. This KPI ties your SEO directly to revenue. It is the most important lagging indicator. |
| How to track | GA4 → Conversions → Filter by ‘Organic Search’ traffic source |
| Benchmark | E-commerce: 2–3% | B2B: 3–5% | SaaS: 5–7%. Always compare against your own historical baseline first. |
| Pro tip | Exclude spam, bot traffic, and wrong-country sessions to avoid inflating your conversion numbers. |
| KPI 14: Organic Revenue & Leads | |
| What it is | The actual revenue or qualified leads generated through organic search traffic. |
| Why it matters | This is the ultimate proof of SEO ROI. If you cannot connect SEO to revenue, you cannot defend the SEO budget. |
| How to track | GA4 with e-commerce tracking or goal completions. Connect to CRM (HubSpot, Salesforce) to track MQL/SQL stages from organic. |
| Benchmark | Depends entirely on your business model and average deal size. Set a month-over-month growth target instead. |
| Pro tip | Track content-assisted deals as well as direct organic conversions. SEO often plays a role earlier in the funnel than last-click attribution shows. |
| KPI 15: Cost Per Acquisition (CPA) from Organic | |
| What it is | Total SEO investment divided by the number of customers acquired through organic search. |
| Why it matters | Organic CPA is typically 3–5x lower than paid CPA over time. This comparison is your most powerful argument for continued SEO investment. |
| How to track | CPA = Total SEO costs for the period / Number of organic conversions in the same period |
| Benchmark | B2B common benchmarks: 1–3% conversion rate, 3–5% CTR, and 200%+ ROI from SEO are reference points. |
| Pro tip | Organic CPA improves over time as content compounds. Show stakeholders a 12-month trend, not just a single month. |
SEO KPI Quick-Reference Benchmark Table
Here is a summary of all 15 SEO KPIs with their benchmarks and tracking tools in one place:
| KPI | Beginner Benchmark | Healthy Range | Tracking Tool |
| Organic Traffic | 500–1k sessions/mo | 5–10% MoM growth | GA4 |
| Keyword Rankings | Top 20 | Position 1–3 for target KWs | Ahrefs / Semrush |
| CTR | 1–2% | 3–5% (position 1 = ~27.6%) | Search Console |
| Engagement Rate | 40–55% | 55–70%+ (blog pages) | GA4 |
| Core Web Vitals | Needs improvement | Good (LCP < 2.5s, CLS < 0.1) | PageSpeed Insights |
| Domain Rating (DR) | 0–20 | 3–5 point gain/year | Ahrefs |
| Referring Domains | < 50 | 5–15 new/month | Ahrefs / Semrush |
| Organic Conv. Rate | < 1% | E-com 2–3%, B2B 3–5%, SaaS 5–7% | GA4 |
How to Track SEO KPIs: The Best Tools
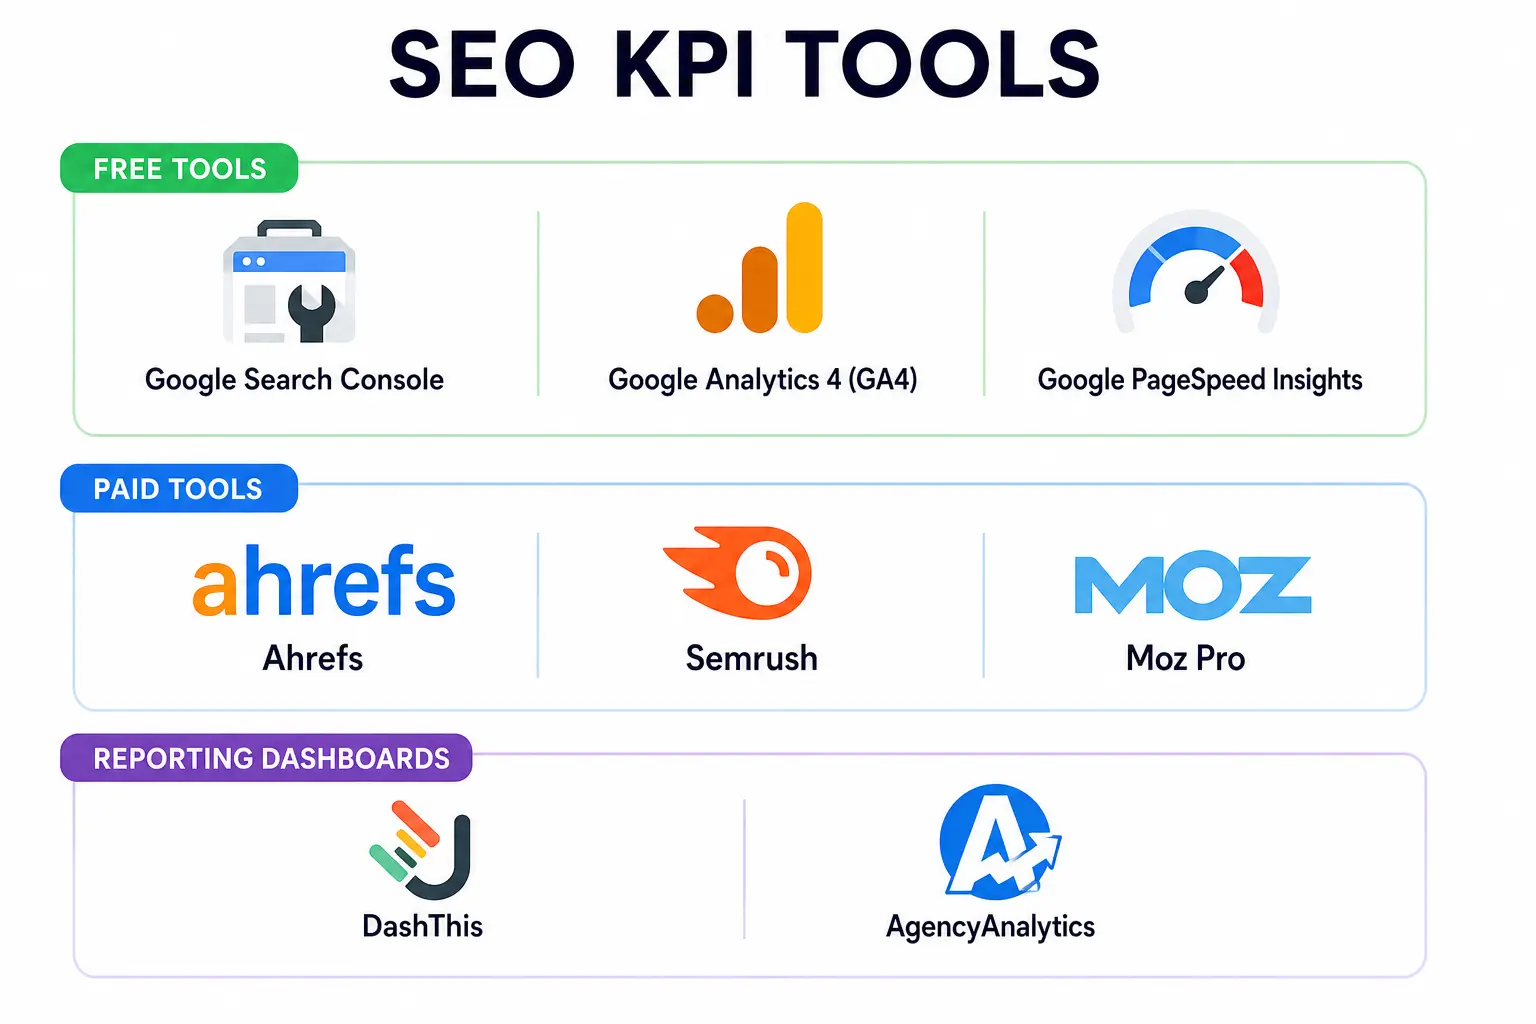
You do not need to pay for ten different tools. Here is how to cover all 15 KPIs with a lean, efficient setup:
Free Tools
- Google Search Console: best for impressions, CTR, keyword rankings, indexation, and Core Web Vitals. If you use one tool, use this one.
- Google Analytics 4 (GA4): tracks organic traffic, engagement rate, session duration, and conversions. Essential for connecting SEO to revenue.
- Google PageSpeed Insights: measures Core Web Vitals (LCP, INP, CLS) for any page, on mobile and desktop.
Paid Tools (Worth the Investment)
- Ahrefs: keyword rankings, referring domains, domain rating, competitor gap analysis, and backlink monitoring. Best all-rounder for authority KPIs.
- Semrush: similar to Ahrefs with strong site audit features. Excellent for technical SEO monitoring and position tracking.
- Moz Pro: good for domain authority tracking and local SEO KPIs.
Reporting Dashboards
- DashThis: pulls data from GA4, Search Console, Ahrefs, Semrush, and 30+ sources into a single automated report.
- AgencyAnalytics: popular for agencies. Includes automated KPI dashboards, GSC integration, and white-label reporting.
AI Visibility Tracking (2026)
This is a new category with no dominant tool yet. The most practical approach is prompt-based monitoring: regularly test your brand’s top 10–20 queries in Google AI Overviews, ChatGPT, and Perplexity. Log whether your brand or URL is cited. Over time, this becomes a trackable trend.
How Often Should You Review SEO KPIs?
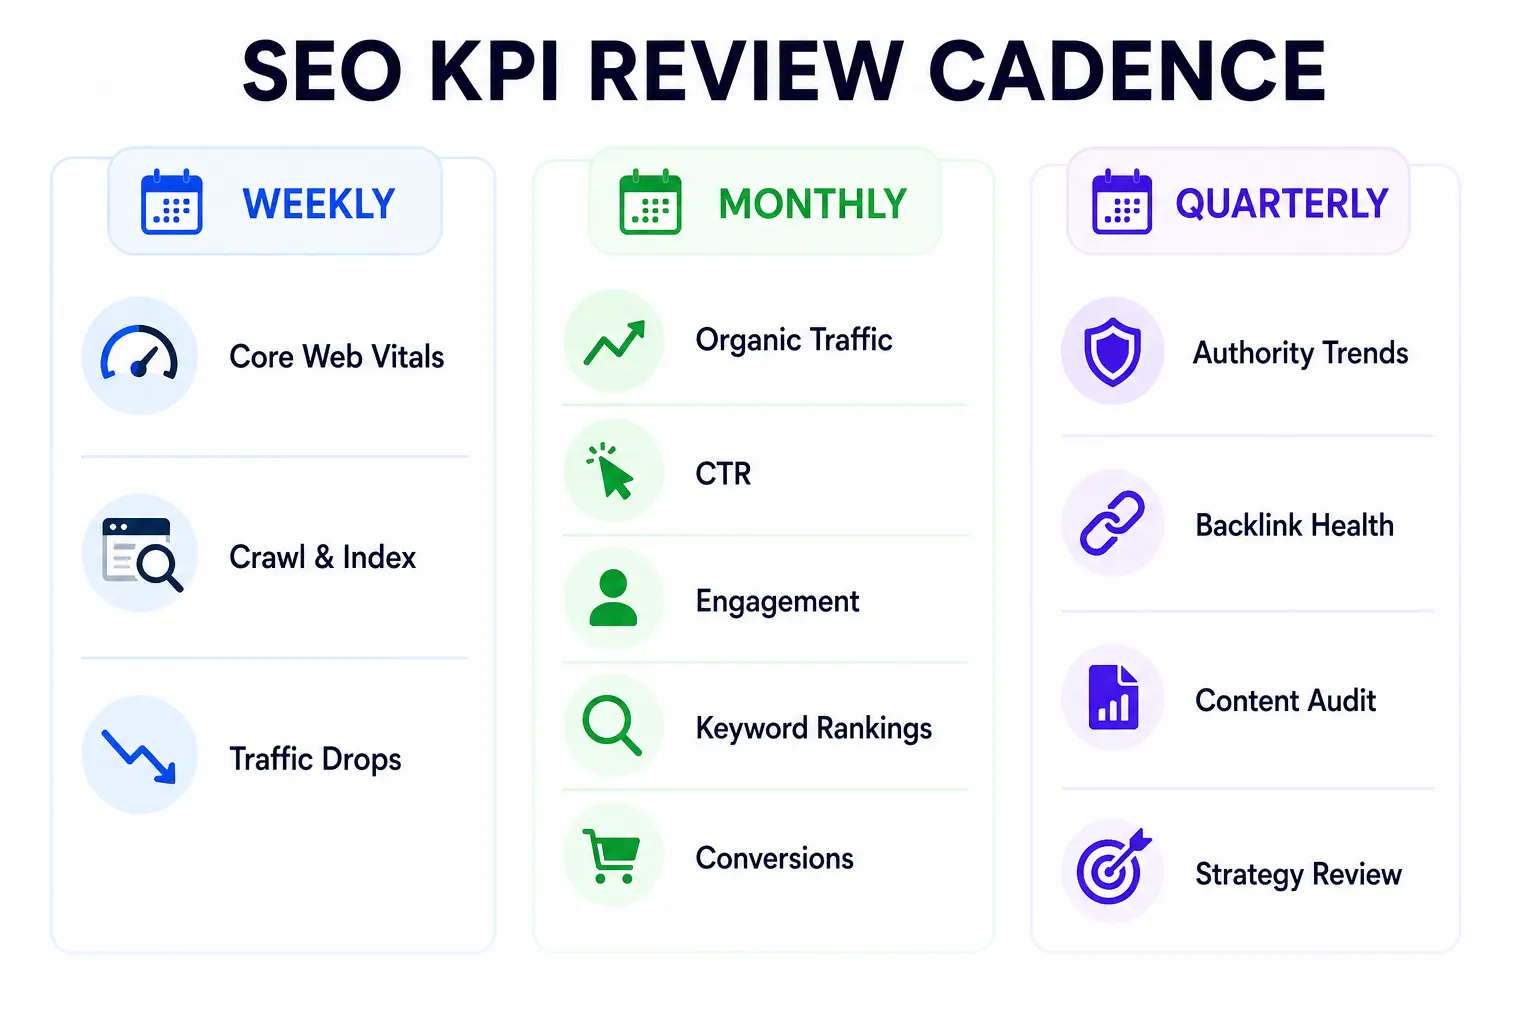
Checking your rankings every morning is a fast track to anxiety, not insight. SEO moves slowly, and over-monitoring creates noise. Here is a sensible review cadence:
Weekly
- Core Web Vitals scores: catch technical regressions early
- Crawl errors and indexation issues: via Search Console
- Sudden drops in organic traffic: check for manual penalties or algorithm updates
Monthly
- Organic traffic (total and segmented by branded vs. non-branded)
- CTR by page and query
- Engagement rate and average session duration
- Keyword rankings for your top 20–50 target keywords
- Conversions and organic revenue
Quarterly
- Domain authority / domain rating trends
- Referring domain growth and backlink profile health
- Content performance audit — which pages grew, which declined, and why
- Full SEO strategy review — are your KPI targets still aligned with business goals?
Common SEO KPI Mistakes to Avoid
Even experienced SEO professionals fall into these traps. Knowing them in advance saves you months of misdirected effort.
Tracking Too Many KPIs
If you track everything, you act on nothing. Stick to 5–7 KPIs that directly connect to your business goals. The rest are context metrics useful when diagnosing problems, not for weekly reporting.
Relying on Rankings Alone
Keyword rankings are important, but they no longer tell the full story. In 2026, AI Overviews frequently reduce clicks from ranked pages. A page can hold position 1 while organic clicks to it decline. Rankings need to be paired with CTR and traffic data to mean anything.
Ignoring the Branded vs. Non-Branded Split
A brand awareness campaign or press mention can spike your organic traffic dramatically but that is not SEO performance. Always separate branded and non-branded traffic before drawing conclusions about your SEO strategy.
Working with Site-Wide Averages
Averages hide everything. A 3% site-wide CTR might look fine until you realise that your highest-impression pages have 0.5% CTR. Segment by page, query, device, and country. That is where the real insights live.
Failing to Connect SEO to Revenue
If your monthly SEO report shows traffic and rankings but does not mention leads, conversions, or revenue, it will not survive the next budget conversation. Make sure at least one of your core KPIs ties directly to business outcomes.
Frequently Asked Questions about SEO KPIs
What are SEO KPIs?
SEO KPIs (Key Performance Indicators) are measurable values that show whether your SEO strategy is achieving your business goals. Unlike general SEO metrics (which just report data), KPIs are tied to specific outcomes like traffic growth, leads, or revenue.
What is the most important SEO KPI?
It depends on your business goal. For most sites, organic conversion rate or organic revenue is the most important because it directly ties SEO to business results. For newer sites still building visibility, organic traffic and keyword rankings take priority.
How do I set SEO KPI benchmarks?
Start with your own historical data before comparing to industry averages. Set a baseline for each KPI, then define a realistic target (e.g. 10% traffic growth over 90 days). Use industry benchmarks as a reference, not as a standard you must hit.
What SEO KPIs should I report to clients?
Focus on KPIs that connect to their business goals: organic traffic, keyword rankings, conversions, and revenue from organic search. Pair these with a leading indicator (like CTR or engagement rate) to show both progress and outcomes.
Are keyword rankings still a good SEO KPI in 2026?
Yes, but only when used intelligently. Rankings need to be paired with CTR and organic traffic data to be meaningful. With AI Overviews reducing clicks from ranked pages, a page can hold position 1 while receiving fewer visits than before. Always look at rankings in context.
Conclusion: Start Tracking the Right SEO KPIs Today
SEO without clear KPIs is just guesswork dressed up in charts. The businesses that grow their organic presence consistently are not the ones tracking the most metrics they are the ones tracking the right ones.
Here is your action plan:
- Set up Google Search Console and GA4 if you have not already
- Pick 5–7 SEO KPIs that align with your current business goal
- Define your baseline for each KPI using the past 3–6 months of data
- Set SMART targets and a review cadence (monthly for most KPIs)
Connect at least one KPI directly to revenue or leads