Your visitors decide whether to stay or leave before they read a single word they judge how fast your site appears. In 2026, a slow website doesn’t just frustrate users; it actively costs you rankings, conversions, and revenue every single day. Website speed optimization is the practice of making your pages load faster and feel effortless on every device. This guide walks you through exactly what’s slowing you down, which techniques move the needle most, and how to keep your site fast as it grows.
Why Website Speed Matters in 2026
User patience has never been shorter. Today, more than half your mobile visitors leave if your page takes over 3 seconds to load — and every extra second costs you roughly 7% of conversions. These aren’t soft metrics; they’re direct hits to your bottom line.
| < 2sTarget Load TimeUser expectation | 53%Mobile Bounce RatePages > 3 sec | 42%Pass CWVMobile sites 2026 | 7%Conv. LossPer extra second |
Speed also affects how your site ranks. Google’s Core Web Vitals are a confirmed ranking signal, and only 42% of mobile websites pass all three thresholds in 2026 meaning a faster site is a real competitive advantage in search, not just a better user experience.
What Is Website Speed Optimization?
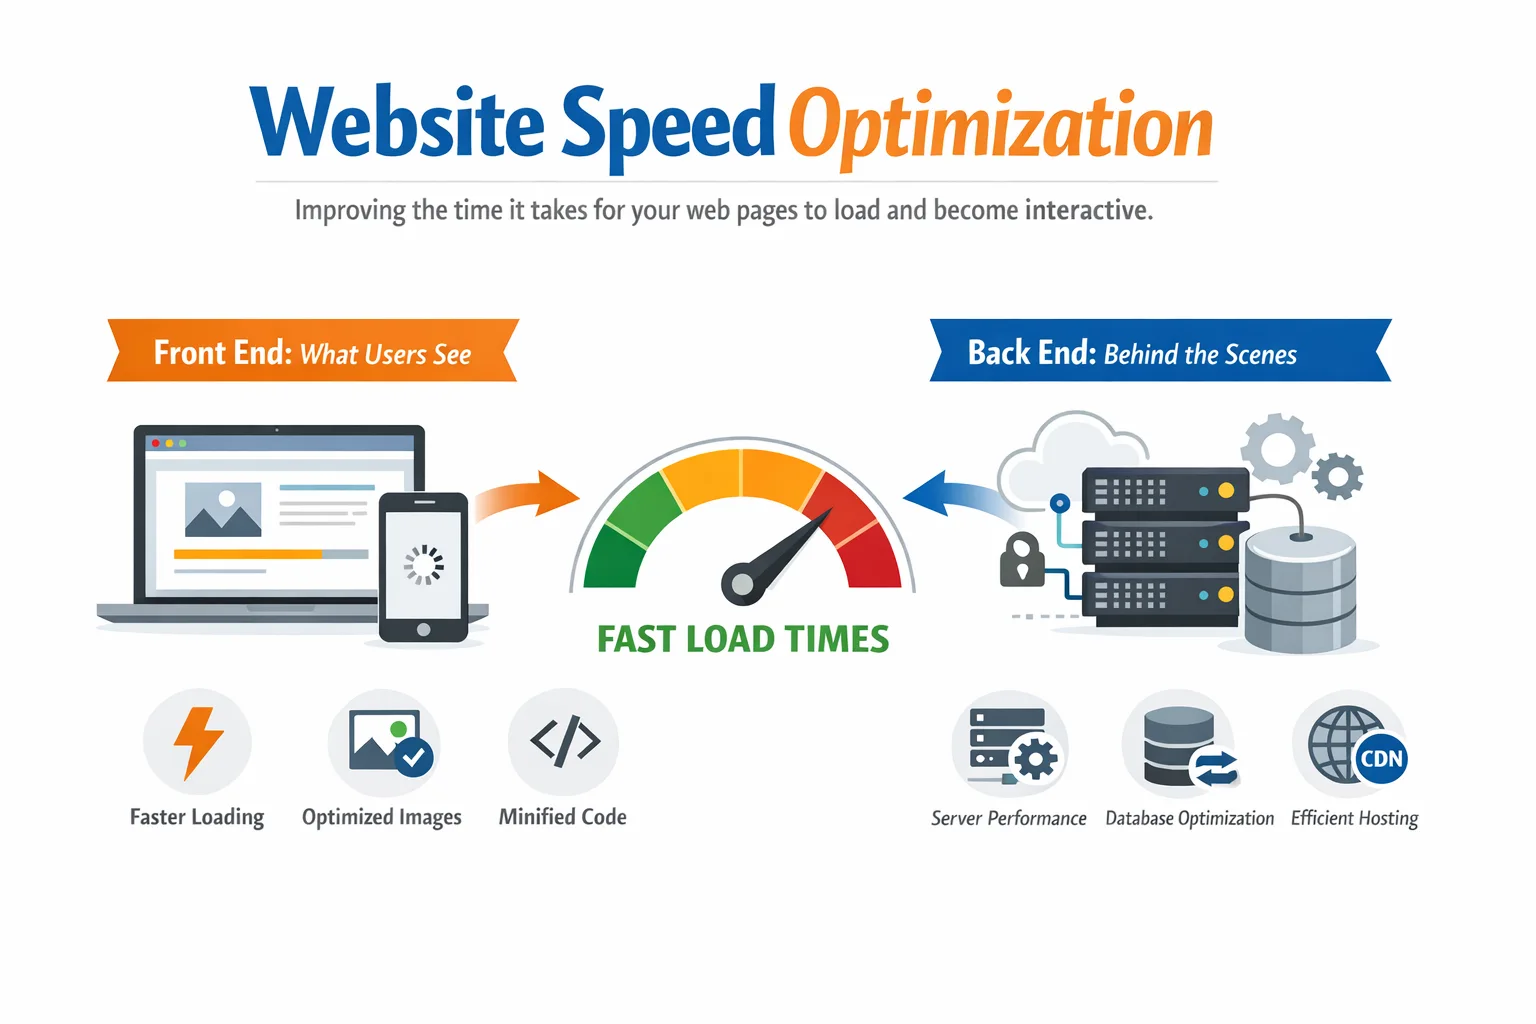
Website speed optimization is the process of reducing the time it takes for your web pages to load, render, and become interactive. It covers both the front end what users see and the back end your server, database, and infrastructure.
Think of your website like a restaurant. The server is your kitchen, the code is your recipe, and the images and files are your ingredients. Speed optimization means making sure the kitchen runs without bottlenecks, the recipe doesn’t call for unnecessary steps, and the ingredients arrive fresh so customers get served quickly every single time.
It is both a technical SEO discipline and a user experience practice. The fastest websites in 2026 treat performance not as a one-time project but as an ongoing culture testing regularly, monitoring continuously, and improving incrementally.
Core Web Vitals: Google’s Speed Report Card
Google measures speed through a set of metrics called Core Web Vitals. These are measured from real Chrome user data not just lab tests and they are used directly in Google’s ranking algorithm. Here’s what each one means:
| Metric | What It Measures | Good Threshold | What Fails It |
| LCP | Largest content load | Under 2.5 seconds | Unoptimized hero images, slow server |
| INP | Click/tap responsiveness | Under 200ms | Heavy JavaScript, long tasks |
| CLS | Layout stability | Under 0.1 score | Images without dimensions, injected ads |
LCP — Largest Contentful Paint
LCP measures how long it takes for the largest visible element on your page to fully render. This is usually your hero image, above-fold heading, or a banner. Google considers LCP under 2.5 seconds ‘good.’ Anything over 4 seconds is ‘poor’ and actively hurts your ranking.
The most common LCP killers are unoptimized hero images, slow server response times, and render-blocking resources that delay the browser from even starting to paint the page.
Interaction to Next Paint
INP replaced the older FID (First Input Delay) metric in March 2024. It measures how quickly your page responds when a user interacts with it clicking a button, expanding a menu, or typing in a form. Target is under 200 milliseconds. Pages that feel sluggish to interact with, even if they look loaded, fail INP.
Heavy JavaScript execution and long main-thread tasks are the primary cause of poor INP scores. JavaScript frameworks with large bundles are particularly vulnerable if not carefully optimized.
Cumulative Layout Shift
CLS measures how much your page layout unexpectedly shifts while loading. You’ve experienced bad CLS when you’re about to click a button and it jumps down the page because an image or ad loaded above it. The target is a score under 0.1.
The fix for CLS is almost always structural: always set explicit width and height on images, reserve space for dynamic content like ads or embeds, and avoid injecting content above existing elements after the page starts rendering.
What’s Actually Slowing Your Website Down
Most speed problems fall into a handful of categories. Understanding the root cause is more important than blindly running optimization scripts. Here’s what to look for: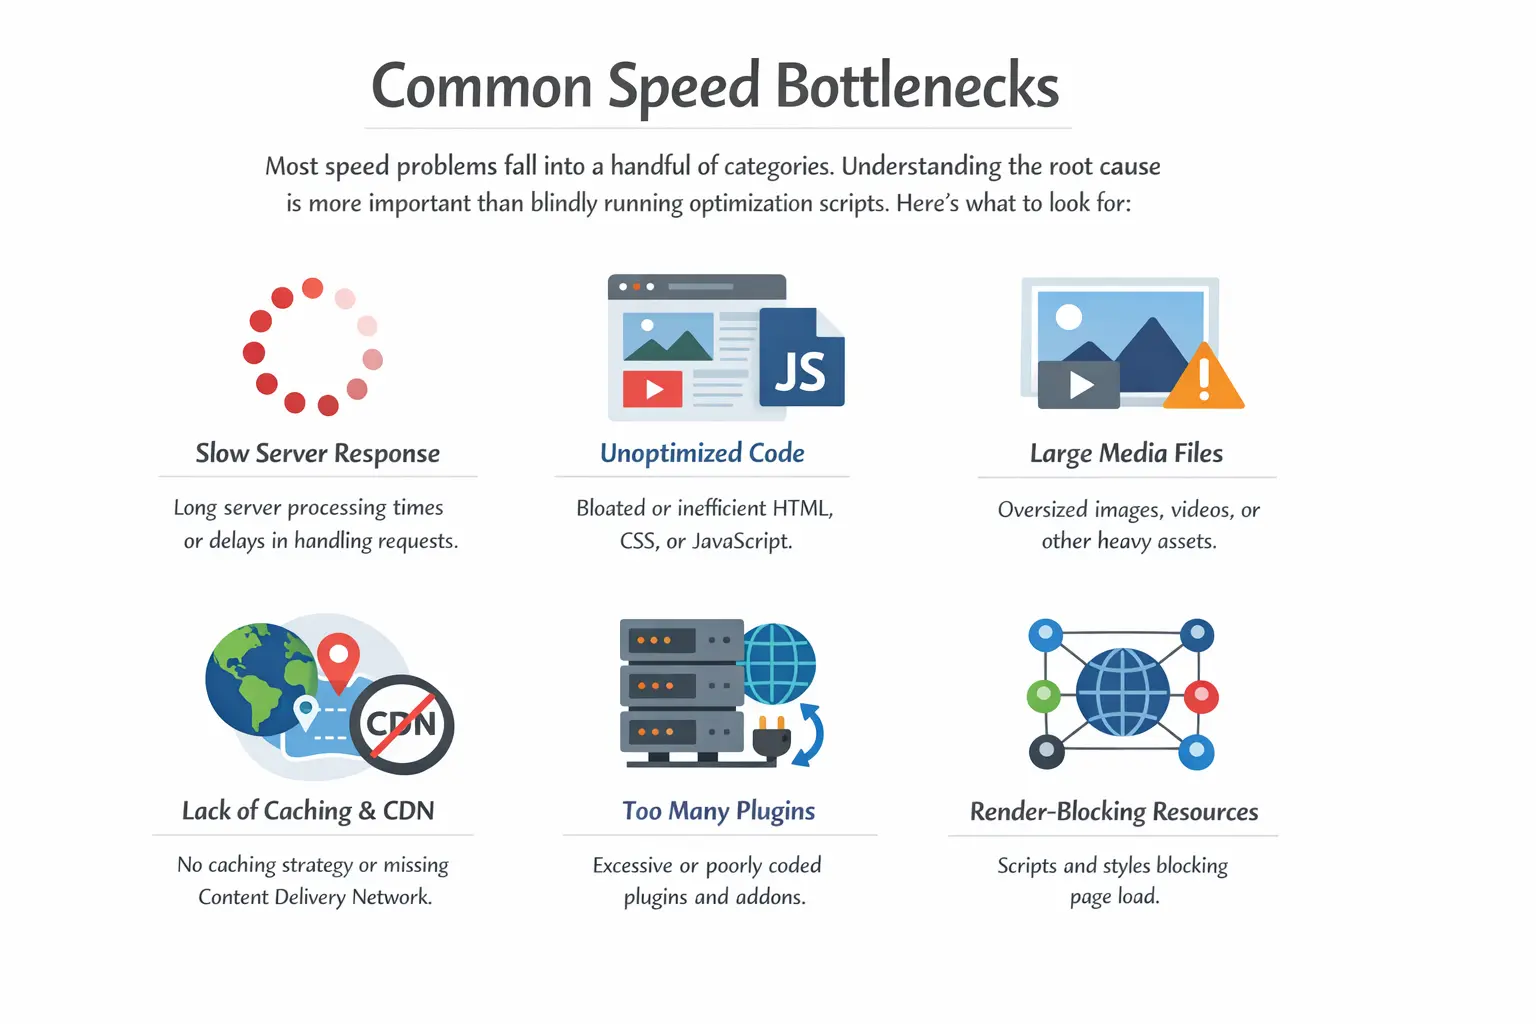
1. Unoptimized Images
Images account for 50–70% of total page weight on the average website. Uploading a 4MB raw photo and letting the browser resize it is one of the most common and costly mistakes. Even a moderately busy page with ten unoptimized images can weigh 15–20MB a disaster on mobile connections.
2. Poor or Shared Hosting
Budget shared hosting places your site on a server alongside thousands of others. When traffic spikes — even on other sites your performance suffers. More critically, shared hosting usually has no server-level caching, which means every page request hits the database and rebuilds the page from scratch, every single time.
3. Render-Blocking Resources
By default, browsers pause rendering your page every time they encounter a CSS or JavaScript file in the HTML. If you have several scripts loading in your page’s head section, users see a blank screen while the browser waits. This is one of the most impactful issues to fix for perceived load speed.
4. Third-Party Script Overload
Every live chat widget, analytics tag, social share button, and ad pixel makes an external HTTP request to a different server. Each one adds latency. Ten of them, each adding 50–150ms, can easily cost you a full second of load time and that’s before accounting for the JavaScript they execute on your page.
5. No Content Delivery Network
Without a CDN, every visitor in the world fetches your files from your single origin server. If your server is in Frankfurt and a visitor is in Singapore, they’re waiting for data to travel over 10,000 km. A CDN stores copies of your static assets at edge locations around the globe and serves them from the nearest point to each visitor.
6. Slow Database Queries
For dynamic platforms like WordPress, WooCommerce, or custom-built applications, slow or unoptimized database queries are often the hidden cause of a high Time to First Byte (TTFB). A page might trigger 50 database queries before it can render. Cleaning up revisions, adding proper indexes, and using object caching can reduce this dramatically.
How to Measure Your Website Speed
Run your site through these tools before making any changes. You need a baseline, and you need to understand which specific issues are causing the most impact. Don’t optimize blind.
| Tool | Type | Best Used For | Free? |
| Google PageSpeed Insights | Lab + Field | First diagnosis, CWV overview | Yes |
| GTmetrix | Lab | Waterfall analysis, deep file audit | Freemium |
| WebPageTest | Lab | Real device, global location testing | Yes |
| Google Search Console | Field (CrUX) | Real user data, 28-day trends | Yes |
| DebugBear | Synthetic monitor | Continuous monitoring, regression alerts | Paid |
| SpeedCurve | Synthetic monitor | Performance budgets, visual timelines | Paid |
Important: always test from a mobile device and from multiple geographic locations. Your site might feel fast to you because you’re geographically close to the server but a visitor on the other side of the world experiences something completely different. Use GTmetrix or WebPageTest to simulate tests from different continents.
Also test with throttled connections in Chrome DevTools. Open DevTools, go to the Network tab, and set throttling to Slow 4G. This is the experience your real mobile users are having.
Website Speed Optimization Techniques Step by Step
Work through these in priority order. The first few techniques deliver the biggest impact for the least effort. The later ones are more advanced and may require developer involvement.
Technique 1: Optimize Every Image
This is where most websites can make the biggest gains the fastest. The approach has four layers:
- Format: Convert all images to WebP. It delivers equivalent quality at 25–35% smaller file sizes than JPEG and 70% smaller than PNG for most images. For next-level performance, AVIF is an emerging format with even better compression — supported by all modern browsers.
- Compression: Compress images before uploading. Tools like Squoosh (free, browser-based), TinyPNG, and ShortPixel all do this well. Target under 200KB for full-width hero images and under 100KB for standard content images.
- Responsive images: Use the srcset attribute to serve different image sizes to different screens. Mobile users shouldn’t download a 1600px wide desktop image just to display it at 400px.
- Lazy loading: Add loading=’lazy’ to all images that are not visible in the initial viewport. The browser only downloads them as the user scrolls toward them, significantly reducing initial page weight.
Technique 2: Implement Caching at Every Layer
Caching stores a pre-built version of your page so that subsequent requests don’t have to rebuild it from scratch. There are multiple layers to caching:
- Browser caching: Set cache-control headers on your server so that static assets images, CSS, JavaScript, fonts — are stored in the visitor’s browser. For most static files, a max-age of one year is appropriate.
- Server-side page caching: For WordPress, plugins like WP Rocket or LiteSpeed Cache generate static HTML versions of your pages. Instead of running PHP and database queries for every visitor, the server serves the pre-built HTML file instantly.
- Object caching: For database-heavy sites, Redis or Memcached store the results of expensive database queries in memory. Repeat queries return instantly without hitting the database again.
Technique 3: Deploy a Content Delivery Network
A CDN is one of the highest-ROI investments in website speed optimization. Popular options include Cloudflare (which has a free tier that’s genuinely useful), BunnyCDN (extremely affordable), and Amazon CloudFront (enterprise-grade). For most websites, adding Cloudflare takes under 30 minutes and can immediately reduce load times by 20–40% for international visitors.
CDNs also serve a secondary benefit: they absorb traffic spikes and DDoS attacks, meaning your origin server handles far less direct load.
Technique 4: Fix Render-Blocking Resources
This is one of the most impactful front-end optimizations and one of the most commonly neglected. Here’s the hierarchy:
- Minify CSS and JavaScript: Strip all unnecessary whitespace, comments, and characters. This reduces file sizes by 15–40% with no functional impact. Most caching plugins handle this automatically.
- Defer non-critical JavaScript: Add the defer attribute to scripts that don’t need to run before the page renders. Deferred scripts load after HTML parsing is complete, so they don’t block the initial paint.
- Async scripts: Add the async attribute to scripts that are completely independent of page content — analytics tags, ad scripts, chat widgets. They load in parallel without blocking rendering.
- Inline critical CSS: Extract the CSS needed to style your above-the-fold content and embed it directly in the HTML. This eliminates the render-blocking stylesheet download for the initial view and is one of the most effective LCP improvements available.
Technique 5: Upgrade Your Hosting Infrastructure
No amount of front-end optimization will fix a server that’s fundamentally underpowered. Here’s how hosting stacks up:
| Hosting Type | TTFB | Best For | Examples |
| Shared Hosting | 500ms–2s+ | Personal blogs only | Bluehost, HostGator |
| VPS Hosting | 200–500ms | Growing sites | DigitalOcean, Linode |
| Managed WP | 100–200ms | WordPress sites | Kinsta, WP Engine |
| Cloud / Edge | 50–150ms | High-traffic, global | Cloudways, Vercel |
If your TTFB is consistently over 400ms, hosting is almost certainly the bottleneck. Managed WordPress hosts like Kinsta and WP Engine include server-level caching, optimized PHP versions, and automated performance tuning that make a significant difference out of the box.
Technique 6: Reduce and Audit Third-Party Scripts
Open your browser’s DevTools Network tab, filter by domain, and count how many external domains your page is calling. Every domain is a separate DNS lookup, TCP connection, and SSL handshake. Audit each script:
- Is this script actively being used? Remove anything that isn’t.
- Can it be loaded asynchronously? Tag it with async or defer.
- Can it be self-hosted? Download the script to your own server to eliminate the external DNS lookup.
- Can it be loaded on user interaction instead of on page load? Defer chat widgets and video embeds until a user clicks or scrolls.
Technique 7: Self-Host Web Fonts and Optimize Loading
Loading Google Fonts from fonts.googleapis.com adds an external DNS lookup and connection to every page load. Self-hosting your fonts eliminates this. Download the font files, host them on your server, and reference them directly via @font-face in your CSS.
Additionally, always set font-display: swap in your @font-face declarations. This tells the browser to show a fallback font immediately and swap it for the web font when it loads preventing the Flash of Invisible Text (FOIT) that contributes to poor CLS and a frustrating user experience.
Mobile Speed Optimization — Your Primary Priority
Google uses mobile-first indexing. That means it crawls, evaluates, and ranks your site based on the mobile version. Your desktop score is almost irrelevant from an SEO standpoint if your mobile experience is poor. Mobile cannot be an afterthought it must be the primary target of every optimization you make.
Here’s what matters most for mobile performance:
- Test with real throttling: Open Chrome DevTools, go to the Network tab, and set connection throttling to Slow 4G. This simulates what real users on mobile networks experience. What loads in 1.5 seconds on your fiber connection may take 6 seconds under these conditions.
- Responsive images via the <picture> element: Serve portrait-cropped, smaller images on mobile instead of forcing a wide landscape desktop banner onto a narrow phone screen.
- Font subsetting: Don’t load an entire font family if you only use regular and bold weights. Subset your fonts to load only the characters and weights you actually use — this can cut font file sizes by 60–80%.
- Avoid GPU-heavy animations: CSS animations that trigger GPU repaints (transform and opacity are fine; top, left, width, and height are not) are smooth on high-end devices but can crawl on mid-range Android phones, which still make up a large percentage of global web traffic.
- Eliminate intrusive interstitials: Popups or overlays that appear immediately on mobile are penalized by Google’s Page Experience algorithm and also block content from loading, hurting both CLS and LCP.
WordPress-Specific Speed Optimization
WordPress powers approximately 43% of all websites on the internet. It’s also one of the most frequently slow platforms when left with default settings and a bloated plugin stack. The good news: WordPress has a rich ecosystem of performance tools, and most sites can achieve dramatic improvements with the right configuration.
Caching and Asset Optimization
- WP Rocket is the most feature-complete caching plugin available. It handles page caching, file minification, lazy loading, database cleanup, and CDN integration from a single dashboard. Worth the cost for any serious site.
- LiteSpeed Cache is free and equally powerful but only works on LiteSpeed-powered hosting. If your host runs LiteSpeed (many do), this is the best option.
- W3 Total Cache is free and highly configurable but requires more technical knowledge to set up correctly.
Theme and Plugin Hygiene
- Use a lightweight theme. GeneratePress and Astra are both optimized for performance out of the box. Avoid multi-purpose themes like Divi or Avada for performance-sensitive sites they load large CSS and JavaScript bundles on every page regardless of which features you’re using.
- Audit your plugins quarterly. Use the Query Monitor plugin to identify which plugins are adding the most database queries and PHP execution time. Delete any plugin you’re not actively using.
- Disable plugin features you don’t need. Many plugins load scripts and styles globally WooCommerce, contact form plugins, and sliders are common offenders. Scripts should only load on pages that use them.
Database and Server
- Use a managed WordPress host (Kinsta, WP Engine, Cloudways) for server-level full-page caching, PHP 8.2+, and Redis object caching included by default.
- Run regular database cleanups to remove post revisions (limit to 5 maximum), auto-draft posts, spam comments, expired transients, and orphaned post metadata.
- Enable Redis or Memcached object caching if your host supports it this is especially impactful for WooCommerce stores that cannot use full-page caching for logged-in users.
Advanced Techniques for 2026
Once you’ve covered the fundamentals, these advanced techniques can push your performance into elite territory. Some require developer involvement; all are worth understanding.
HTTP/3 and QUIC
HTTP/3 uses the QUIC transport protocol (UDP-based) instead of the traditional TCP. The key advantage: it eliminates head-of-line blocking, where a single lost packet causes the entire connection to stall. On mobile networks with packet loss, HTTP/3 can deliver 100–300ms of improvement on initial load. Check your hosting provider’s support Cloudflare enables it automatically for sites behind their CDN.
Preloading Critical Resources
Add resource hints in your page’s head section to tell the browser what to fetch before it even discovers those resources while parsing HTML:
- <link rel=’preload’> for your LCP image the browser fetches it at the highest priority, immediately improving LCP scores.
- <link rel=’preconnect’> for external domains your page depends on (font servers, analytics, CDN origins) — this establishes the connection early so it’s ready when needed.
- <link rel=’dns-prefetch’> for less critical third-party domains resolves DNS early at minimal cost.
Code Splitting
Modern JavaScript bundlers like Webpack and Vite support code splitting breaking your JS bundle into smaller chunks that only load when needed. Instead of forcing every visitor to download your entire application’s code on the first page load, only the code required for that specific page and its components is loaded. This is particularly impactful for React, Vue, and Angular applications.
Edge-Side Rendering and Edge Functions
Platforms like Vercel, Netlify, and Cloudflare Workers allow you to run server-side logic at the network edge geographically close to your users. This dramatically reduces TTFB for dynamic content without the overhead of a traditional origin server response. For high-traffic marketing sites, this architecture can push TTFB below 50ms globally.
Performance Budgets in CI/CD
Set performance budgets in your build and deployment pipeline: maximum JavaScript bundle size (e.g., under 300KB), maximum page weight (under 1.5MB), LCP threshold (under 2.5s). Tools like Lighthouse CI, Calibre, and DebugBear can automatically fail a deployment that violates these budgets preventing performance regressions from ever reaching production.
How to Monitor Website Speed Over Time
Speed optimization is not a project you complete it’s a practice you maintain. New content, plugin updates, third-party script changes, and traffic growth all affect your performance over time. Here’s a monitoring framework that scales with your site:
After Every Major Change
Run a manual test on Google PageSpeed Insights and GTmetrix immediately after any significant change: installing a new plugin, publishing a new page template, updating your theme, or adding a new third-party integration. Catching regressions immediately is far easier than diagnosing a speed problem months later.
Weekly
Review your Core Web Vitals report in Google Search Console. This shows real user data segmented by page group, device type, and status (good / needs improvement / poor). Set up email alerts in Search Console for significant CWV changes.
Continuous
Set up automated synthetic monitoring with DebugBear or SpeedCurve. These tools run scheduled tests from fixed locations, track your metrics over time, and alert you when performance drops below a threshold. This is how you catch regressions caused by third-party script updates that happen without your knowledge.
Quarterly
Run a full performance audit. Review your third-party script inventory, test on new device profiles (mid-range Android phones, not just iPhones), and re-evaluate your hosting plan against your current traffic levels. Document all changes for regression tracking.
Remember: CrUX (Chrome User Experience Report) data reflects a 28-day rolling window. After you make optimizations, real-user metrics won’t fully update for up to four weeks. Use lab data (Lighthouse, GTmetrix) to validate changes immediately; use CrUX data to confirm the real-world impact over time.
Common Website Speed Optimization Mistakes to Avoid
Even experienced teams fall into these traps. Knowing them in advance saves weeks of troubleshooting:
- Over-compressing images: There is a point of diminishing returns where further compression produces visible artifacts without meaningful file size savings. Test visually don’t just target the smallest byte count.
- Desktop-only thinking: If your optimization workflow is ‘test on Chrome on my MacBook,’ you’re missing the real picture. The majority of global web traffic is mobile, and many of your users are on mid-range devices with slower connections.
- Set-and-forget mentality: A performance audit done once at launch means nothing six months later. Sites that stay fast are sites where performance is part of the ongoing development process, not a one-time checkbox.
- Optimizing for the score, not the experience: A 100/100 Lighthouse score that’s achieved by deferring everything and removing useful features is a hollow victory. Optimize for real users, not the number.
- Conflicting optimization plugins: Running WP Rocket alongside W3 Total Cache alongside another caching layer is a recipe for bugs, blank pages, and performance that’s worse than no caching at all. One plugin, one job, done well.
- Ignoring TTFB: Most speed guides focus heavily on front-end asset optimization. But if your TTFB is 800ms, no amount of image compression will fix your LCP. Server response time is the foundation — everything else builds on top of it.
Website Speed Optimization Checklist
Use this checklist as your implementation roadmap. Work through High priority items first, then Medium, then Advanced. Ongoing items should become part of your regular workflow.
| Optimization Task | Priority | |
| ☐ | Images converted to WebP format | High |
| ☐ | Images compressed under 200KB (hero) / 100KB (content) | High |
| ☐ | Lazy loading enabled for below-fold images | High |
| ☐ | Browser caching headers configured | High |
| ☐ | CDN enabled and serving static assets | High |
| ☐ | Page caching plugin active (WP Rocket / LiteSpeed) | High |
| ☐ | CSS, JS, and HTML minified | Medium |
| ☐ | Render-blocking JS deferred or async | Medium |
| ☐ | Web fonts self-hosted with font-display: swap | Medium |
| ☐ | Unused third-party scripts removed or deferred | Medium |
| ☐ | TTFB under 200ms | Medium |
| ☐ | LCP element preloaded in <head> | Medium |
| ☐ | Critical CSS inlined above the fold | Advanced |
| ☐ | HTTP/3 / QUIC enabled on hosting | Advanced |
| ☐ | Code splitting configured in JS build | Advanced |
| ☐ | Performance budget set in CI/CD pipeline | Advanced |
| ☐ | Core Web Vitals monitored in Search Console | Ongoing |
| ☐ | Synthetic monitoring set up (DebugBear/SpeedCurve) | Ongoing |
| ☐ | Quarterly speed audit scheduled | Ongoing |
Frequently Asked Questions
What is a good website speed score in 2026?
On Google PageSpeed Insights, a score of 90 or above on both mobile and desktop is the target. However, the score itself is a lab metric what matters more is your real-user Core Web Vitals data in Google Search Console. A site with a Lighthouse score of 82 that passes all three CWV thresholds in the field will outperform a site with a 96 lab score that fails in the real world.
How does website speed affect SEO rankings?
Page speed is a confirmed Google ranking factor through Core Web Vitals (LCP, INP, CLS), which are part of Google’s Page Experience signals. Slow pages may rank below competitors with similar content but better performance. Speed also indirectly affects SEO by influencing bounce rate, dwell time, and crawl budget — all of which send quality signals to Google.
What is the ideal page load time in 2026?
For LCP, the target is under 2.5 seconds. For Time to First Byte (TTFB), aim for under 200ms. Total page load time should be under 3 seconds on a standard mobile connection (Fast 3G / Slow 4G). These are Google’s defined thresholds anything above these ranges is classified as ‘needs improvement’ or ‘poor.’
Does website speed affect conversion rates?
Yes, significantly. Research consistently shows that every additional second of load time reduces conversions by approximately 7%. Google’s own data shows that e-commerce sites passing Core Web Vitals see 24% fewer visitor abandonments. For lead generation sites, every second of delay reduces the likelihood of a visitor completing a form or taking an action.
What is the fastest way to speed up a website?
The three highest-impact, lowest-effort changes are: (1) compress and convert your images to WebP, (2) enable a caching plugin, and (3) add a CDN. These three steps alone can dramatically cut load times in a single afternoon. After that, address hosting quality and render-blocking scripts for the next tier of improvement.
How often should I audit my website’s speed?
Run a manual test after every major change. Review Google Search Console Core Web Vitals weekly. Set up continuous automated monitoring for daily visibility. Run a full comprehensive audit quarterly reviewing third-party scripts, testing on new device profiles, and benchmarking against competitors.
Conclusion
Website speed optimization in 2026 is not optional. It is a core requirement for ranking in search, retaining visitors, and converting them into customers. Fast websites rank higher, convert better, and earn more trust not because of a single dramatic change, but because of dozens of small, compounding improvements made consistently over time.
The roadmap is clear: start with images, add caching and a CDN, fix render-blocking resources, upgrade your hosting if needed, and then work your way through the advanced techniques as your site and skills grow. Use the checklist in this guide to track your progress.
Most importantly: keep testing. Run your site through Google PageSpeed Insights today. Pick the top issue on the list. Fix it. Test again. Repeat. That’s the entire discipline of website speed optimization — and it’s one of the highest-return investments you can make in your online presence.