Traffic analysis, in the context of digital marketing, is the practice of collecting and interpreting data about how visitors interact with your website. Think of it as your website’s health check it tells you what is working, what is not, and what needs attention.
Here is the key distinction that most beginners miss: traffic numbers and traffic insights are very different things. Knowing that you got 10,000 visits last month means nothing on its own. Knowing that 8,000 of those visits came from one blog post, and 60% of those visitors clicked through to your pricing page that is insight.
Why Traffic Analysis Matters for Every Business
- It shows you where your marketing budget is actually paying off
- It reveals which content your audience finds valuable
- It helps you spot problems before they become expensive
- It gives you data to justify decisions to stakeholders
- It uncovers growth opportunities your competitors might be missing
Types of Website Traffic You Need to Know
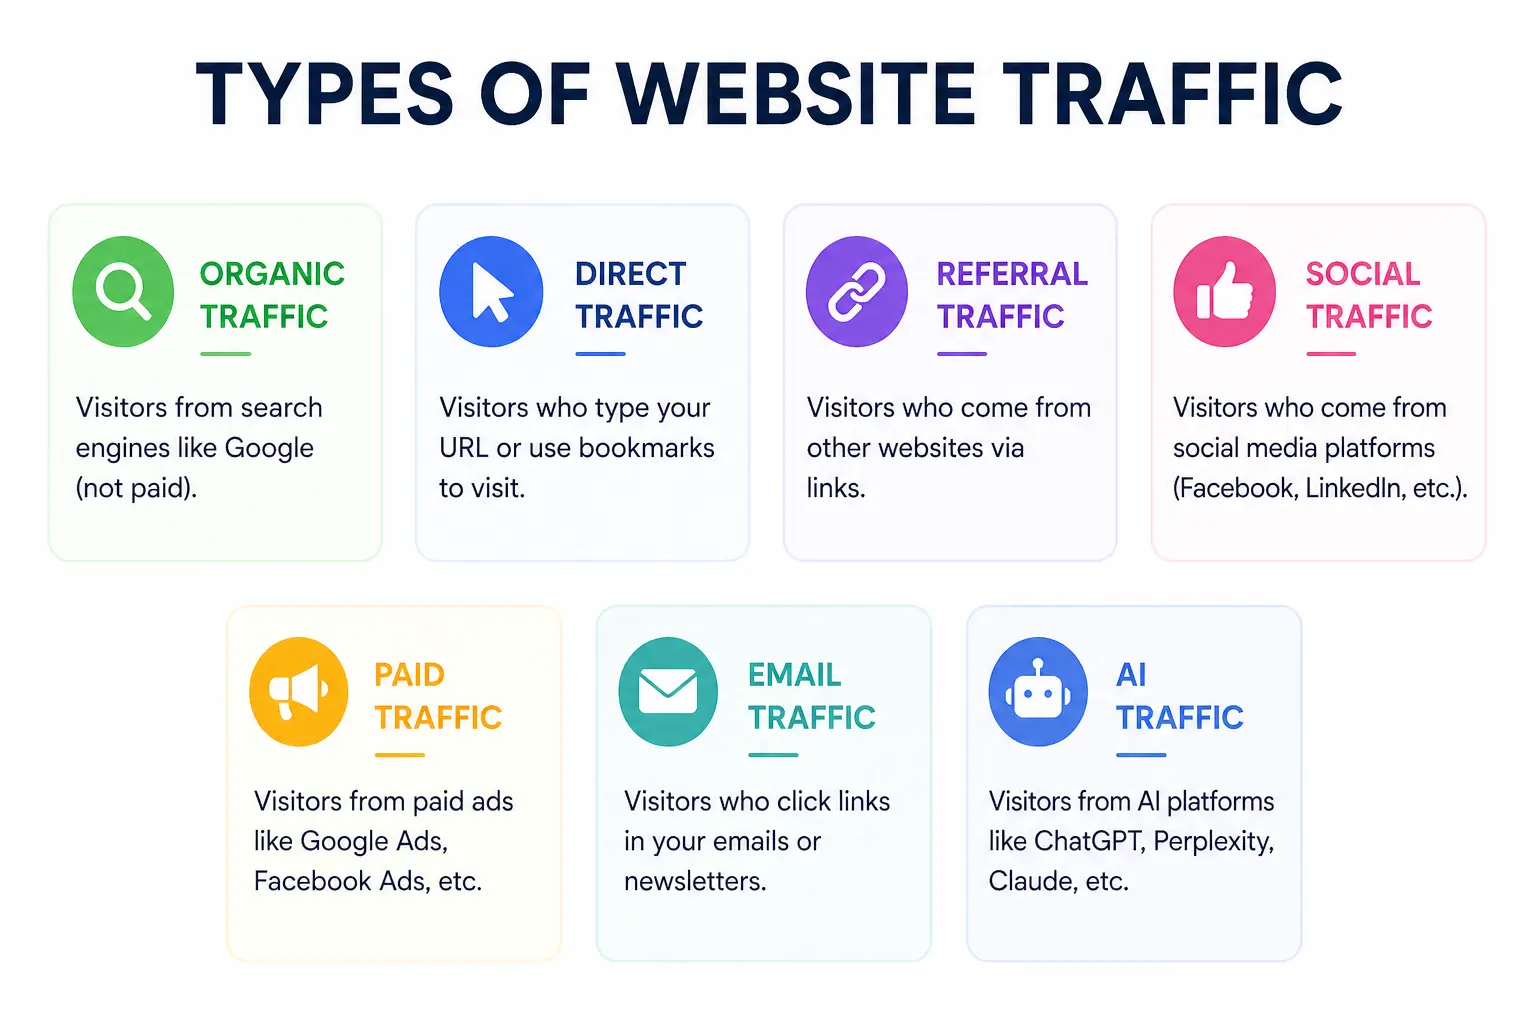
Before diving into analysis, you need to understand the different types of traffic your website can receive. Each source tells a different story about how people are finding you.
1. Organic Traffic
This is visitors who found your website through a search engine like Google or Bing without clicking on an ad. Organic traffic is the gold standard it’s free, sustainable, and signals that your content is genuinely valuable. Strong organic traffic is the result of good SEO, quality content, and a technically healthy website.
2. Direct Traffic
Direct traffic comes from people who typed your URL directly into their browser or clicked a saved bookmark. This often indicates strong brand recognition. However, it can also include traffic that cannot be properly attributed to another source.
3. Referral Traffic
Referral traffic arrives when another website links to yours and a visitor clicks that link. Getting referral traffic from high-authority sites is excellent for both traffic and SEO it signals that others trust your content enough to share it.
4. Social Traffic
Visitors from social media platforms like Facebook, Instagram, LinkedIn, Twitter/X, TikTok, or Pinterest fall into this category. Social traffic can be great for awareness, but it often has higher bounce rates compared to organic traffic.
5. Paid Traffic
Paid traffic, also known as PPC (pay-per-click), comes from ads you run on Google, Meta, or other platforms. It can bring in visitors quickly, but the moment you stop paying, the traffic stops too.
6. Email Traffic
When subscribers click a link in your email newsletter or campaign and visit your site, that’s email traffic. This tends to be some of the highest-quality traffic because these visitors already know and trust your brand.
7. AI Traffic (The New Channel to Watch)
This is one of the most exciting developments in 2025. Platforms like ChatGPT, Perplexity, Gemini, and Copilot are now sending referral traffic to websites they recommend. If you see traffic from these sources, your content is being used by AI assistants to answer real questions a powerful signal of authority.
Key Traffic Metrics You Should Actually Track
There are dozens of metrics available in any analytics platform. Tracking all of them leads to confusion, not clarity. Here are the metrics that genuinely move the needle and what each one is trying to tell you.
| Metric | What It Tells You | Good Benchmark |
| Sessions | Total number of visits to your site | Depends on industry & goals |
| Bounce Rate | % of visitors who left without engaging | Under 40% is strong |
| Avg. Session Duration | How long visitors stay on your site | 2+ minutes is healthy |
| Pages/Session | How many pages each visitor views | 2-4 pages per session |
| CTR | % who click after seeing you in search | 3-5% for organic search |
| Conversion Rate | % of visitors who complete a goal | 2-5% industry average |
A Closer Look at the Metrics That Matter Most
Sessions & Users: A session is a single visit to your website, which can include multiple page views. A user is an individual visitor. Tracking both helps you understand how many unique people are visiting and how often they return.
Bounce Rate: This measures the percentage of visitors who leave after viewing only one page. A high bounce rate is not always bad if someone reads your entire blog post and then leaves, that is a successful visit. Context matters.
Click-Through Rate (CTR): Your CTR in search results tells you how attractive your title and meta description are. Even if you rank on page one, a weak CTR means you are missing out on traffic that is rightfully yours.
Conversion Rate: This is the metric that connects traffic to revenue. It measures the percentage of visitors who complete a desired action a purchase, a form submission, a newsletter signup. Traffic without conversions is just a vanity number.
How to Do Traffic Analysis Step by Step
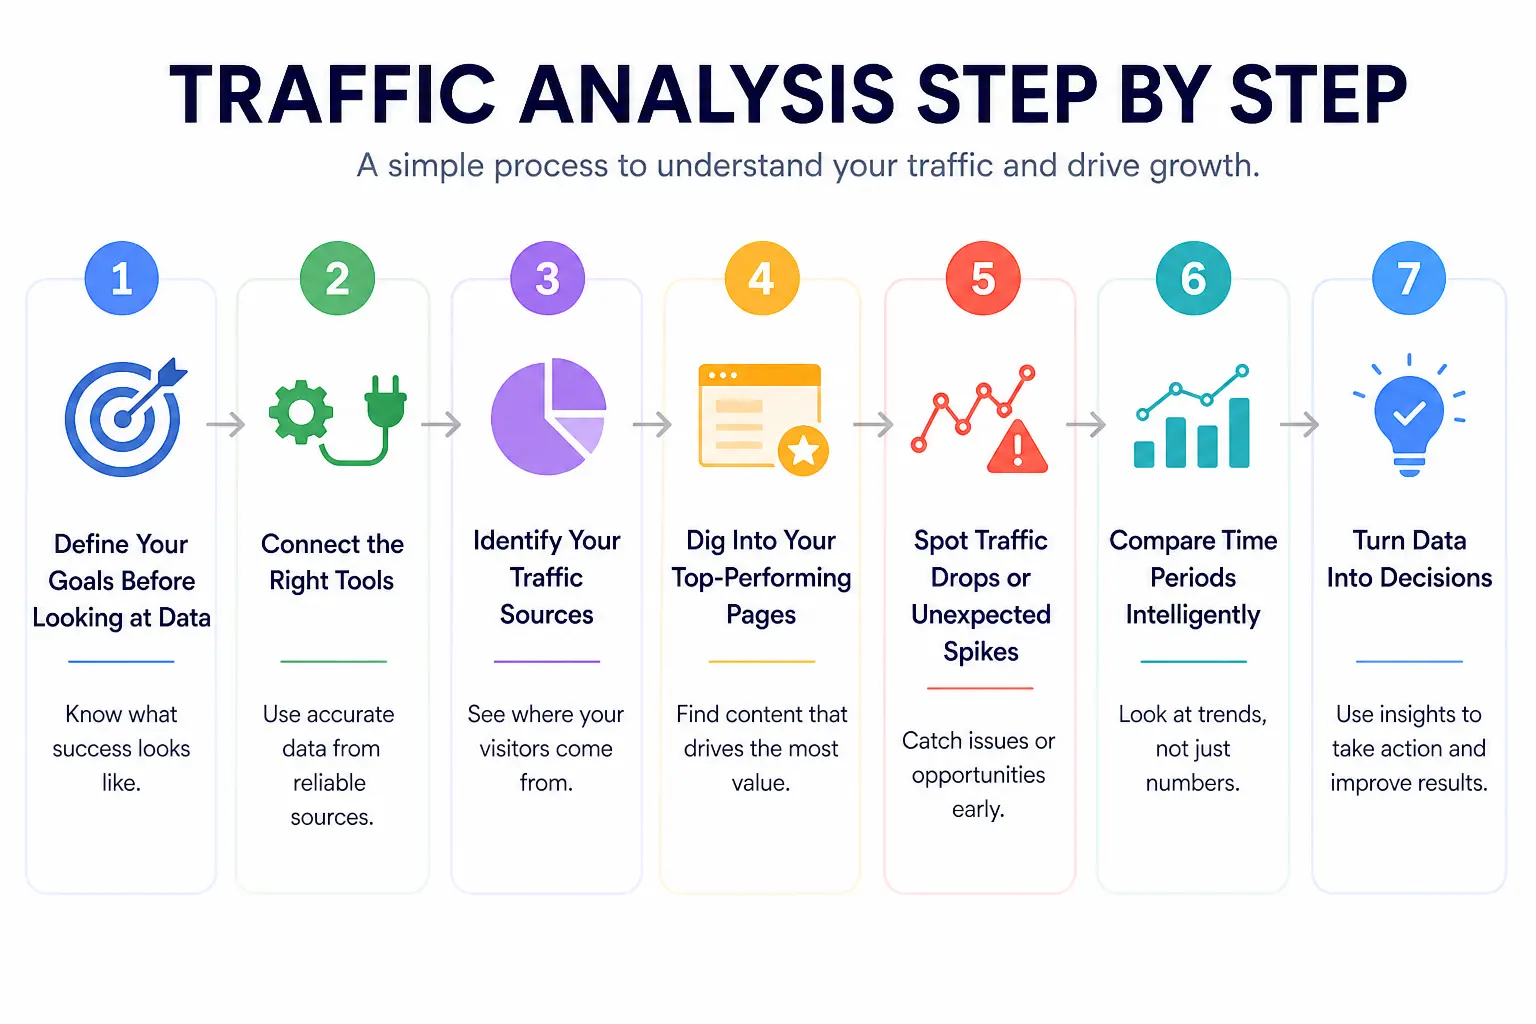
Traffic analysis is not a one-time task it is an ongoing process. Here is a practical, repeatable framework you can follow every month.
Step 1: Define Your Goals Before Looking at Data
This is the step most people skip, and it is the most important. Before opening any analytics tool, ask yourself: what does success look like for my website right now? Are you trying to grow organic traffic, improve conversions, reduce bounce rate, or understand where your audience comes from? Your goals determine which metrics matter and which are noise.
Step 2: Connect the Right Tools
At a minimum, you need Google Analytics 4 (GA4) and Google Search Console. GA4 tells you what happens on your website after visitors arrive. Search Console tells you how your site performs in Google search — which keywords bring traffic, how often your pages appear, and what your CTR looks like. Together, they give you a complete picture of your organic performance.
Step 3: Identify Your Traffic Sources
Head to your acquisition reports and look at where your visitors are coming from. Which channels are growing? Which are declining? If social traffic is dropping while organic is rising, that tells you something very specific about where to invest your time and resources.
Step 4: Dig Into Your Top-Performing Pages
Look at which pages are bringing in the most traffic and why. Is there a pattern? Do long-form guides outperform short posts? Do product pages convert better when they have more images? Understanding what already works gives you a repeatable formula for creating more content that performs.
Step 5: Spot Traffic Drops or Unexpected Spikes
Unusual traffic patterns are signals, not just statistics. A sudden spike might mean a piece of content went viral or someone with a large audience linked to you. A drop could signal a Google algorithm update, a technical issue like broken pages, or seasonal shifts in search demand. Always investigate before drawing conclusions.
Step 6: Compare Time Periods Intelligently
Never evaluate traffic in isolation. Compare month-over-month to spot trends, and year-over-year to account for seasonality. A 20% drop in traffic in December may look alarming until you realize the same thing happened last December — and the year before that.
Step 7: Turn Data Into Decisions
This is where most traffic analysis fails. People collect the data, stare at the charts, and then nothing changes. Every traffic analysis session should end with at least one specific action item: update a page that is losing traffic, improve the meta title on a page with low CTR, or double down on a channel that is outperforming expectations.
Best Traffic Analysis Tools in 2025
The tool you use matters less than how consistently you use it. That said, using the right tool for the job makes a real difference. Here is a breakdown of the best traffic analysis tools available today.
| Tool | Best For | Free? | Skill Level |
| Google Analytics 4 | Complete traffic tracking & user behavior | Yes | Beginner |
| Google Search Console | Organic search data & keyword performance | Yes | Beginner |
| Semrush | Competitor traffic analysis & keyword gaps | Paid | Beginner |
| Ahrefs | Backlink profile & organic traffic estimates | Paid | Beginner |
| HubSpot Analytics | Marketing & traffic reporting combined | Freemium | Beginner |
| Looker Studio | Custom dashboards & shareable reports | Yes | Beginner |
| DashThis | Automated client reporting & KPIs | Paid | Beginner |
How to Choose the Right Tool
If you are just starting out, Google Analytics 4 and Google Search Console are all you need — and both are completely free. Once you want to understand competitor traffic or find keyword gaps, tools like Semrush or Ahrefs add real value. For reporting and client dashboards, Looker Studio (free) and DashThis (paid) are excellent choices.
Best Combo: GA4 + Google Search Console gives you the most complete and accurate picture of your own website traffic and it costs nothing.
Traffic Reporting How to Build Reports People Actually Read
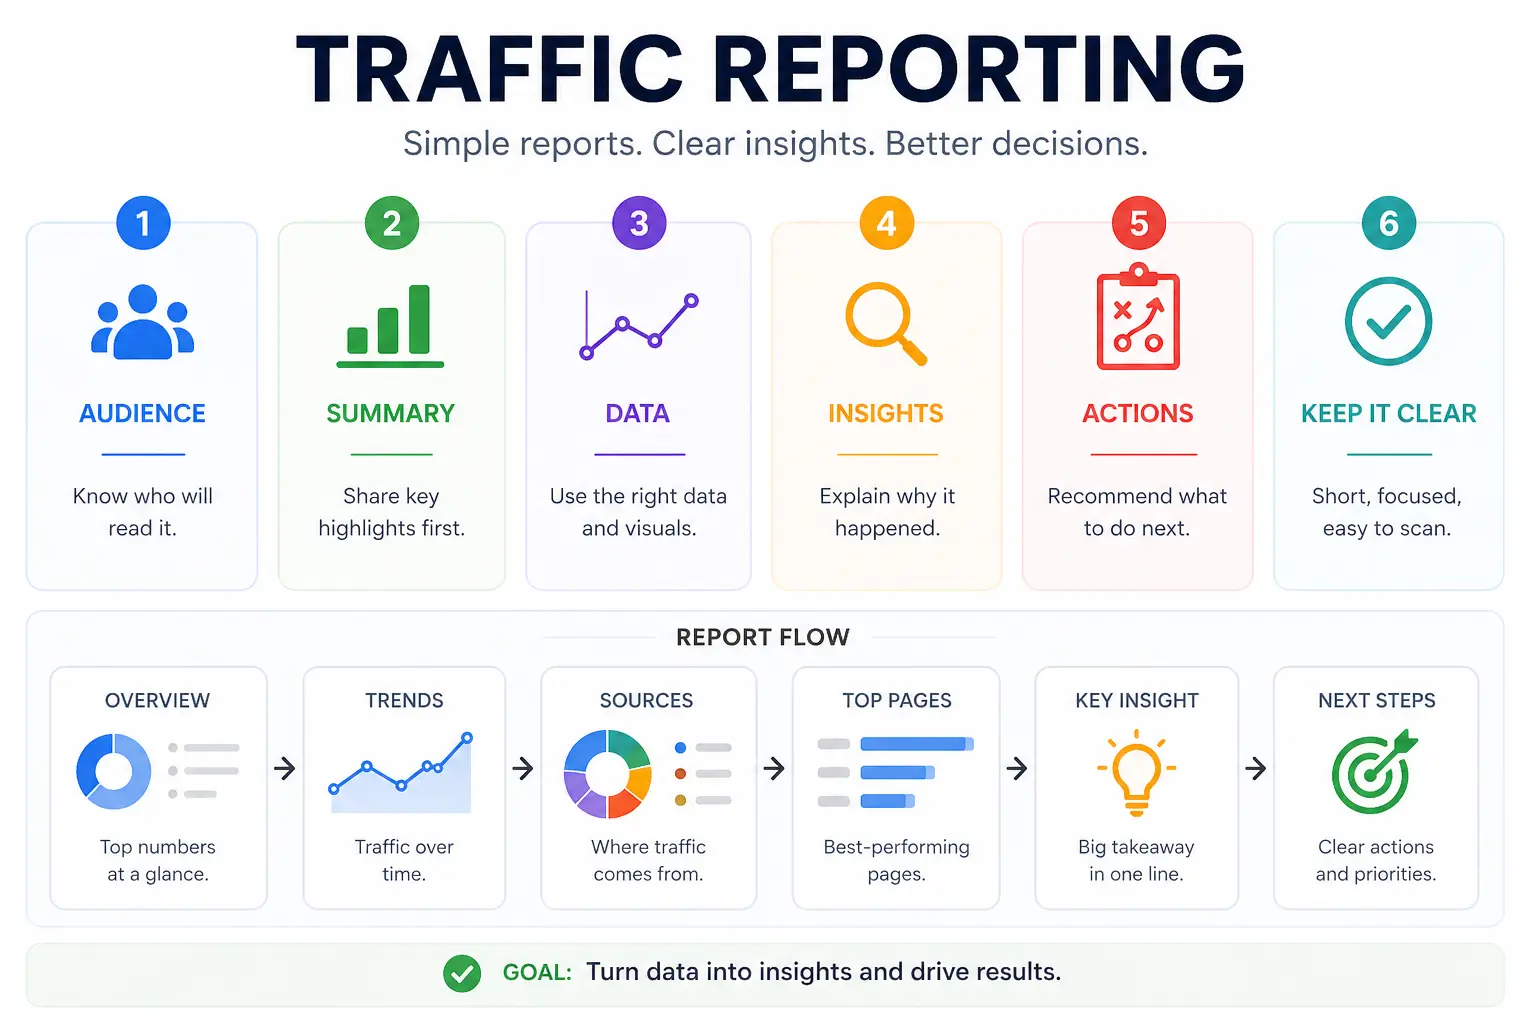
Here is an uncomfortable truth: most traffic reports are ignored. They are either too long, full of numbers that mean nothing to the reader, or they present data without any story behind it. A great traffic report does not just show what happened it explains why it happened and what to do next.
The Anatomy of a Strong Traffic Report
Every solid traffic report should include these core sections:
- Executive Summary: a plain-English overview of the key takeaways in 3-5 sentences
- Traffic Overview: total sessions, users, and comparison to the previous period
- Traffic by Source: which channels drove the most visits and how each is trending
- Top Pages: which content performed best and why it worked
- Keyword Performance: which search terms are driving organic traffic
- Conversions: how many visitors completed a goal, broken down by source
- Recommended Actions: specific next steps, not vague suggestions
Tailor Your Report to Your Audience
A marketing manager wants to see channel performance and content metrics. A CEO wants to see how traffic is connecting to revenue. A developer cares about technical issues that might be impacting load speed and crawlability. The same data, packaged differently, resonates with different people. Know who you are writing for.
How Often Should You Run Traffic Reports?
- Weekly: for fast-moving campaigns or new website launches
- Monthly: the standard for most businesses tracking ongoing performance
- Quarterly: ideal for strategic reviews and stakeholder presentations
- Year-over-year: essential for understanding seasonal patterns
Common Traffic Analysis Mistakes to Avoid
Even experienced marketers fall into these traps. Here is what to watch out for and how to avoid each one.
Mistake 1: Chasing Vanity Metrics
Page views feel impressive, but they rarely tell you anything useful. One page view from a highly targeted visitor who converts is worth more than a hundred random visits. Always ask: what does this number actually mean for my business?
Mistake 2: Not Filtering Out Bots and Internal Traffic
If your team visits your website constantly while developing or testing it, that traffic will inflate your numbers and skew your data. Make sure to exclude your own IP addresses and filter known bot traffic from your reports in GA4.
Mistake 3: Ignoring Mobile Traffic
Around 59% of all internet traffic now comes from mobile devices. If you are not looking at how your mobile visitors behave differently from desktop users different bounce rates, different conversion paths you are missing a huge piece of the picture.
Mistake 4: Comparing the Wrong Time Periods
Comparing this December to last November will give you meaningless data. Always compare equivalent periods this month vs. the same month last year, or this quarter vs. the same quarter last year. Seasonal shifts are real and they will mislead you if you are not accounting for them.
Mistake 5: Analyzing Traffic Without Tying It to Goals
Traffic is a means to an end, not the end itself. If your traffic doubles but your revenue stays flat, something is wrong. Always connect traffic trends to business outcomes leads generated, products sold, sign-ups completed.
Traffic Analysis in the Age of AI Search (2025 Update)
The search landscape is changing faster than at any point in the last decade. AI-powered features like Google’s AI Overviews are reshaping how people find information and how traffic flows across the web. Here is what every marketer needs to understand right now.
Zero-Click Searches Are on the Rise
Around 60% of searches now end without a click, because Google answers the question directly in the search results. This means rankings alone no longer guarantee traffic. Your traffic analysis needs to account for impressions alongside clicks a page can be performing well in search even if CTR appears to drop.
AI Tools Are Becoming Referral Sources
ChatGPT, Perplexity, Gemini, and similar tools are increasingly sending traffic to websites they recommend. If your content is showing up as a source in AI-generated answers, you will start to see these as referral traffic sources in GA4. This is a strong signal that your content has earned real authority.
How to Adapt Your Traffic Analysis Strategy
- Track AI referral traffic as a separate source and watch it grow over time
- Monitor impressions in Google Search Console, not just clicks
- Focus on content that directly answers specific questions — the format AI tools prefer
- Measure brand awareness metrics alongside standard traffic data
- Diversify your traffic sources so you are not dependent on any single channel
Forward Thinking: AI Visibility how often your brand is mentioned in AI-generated answers — is becoming as important as traditional keyword rankings. Start tracking it now.
Traffic Analysis vs. SEO Reporting What Is the Difference?
These two terms are often used interchangeably, but they are not the same thing and understanding the difference will make your reporting much sharper.
Traffic Analysis is the broad study of all visitor behavior across all channels. It covers where people come from, what they do on your site, how long they stay, and whether they convert. It looks at organic, paid, social, direct, and referral traffic equally.
SEO Reporting is specifically focused on how your website performs in search engines. It dives into keyword rankings, organic click-through rates, crawlability, backlinks, and technical health all the factors that determine how well Google ranks your pages.
You need both. Traffic analysis tells you whether your overall digital presence is healthy. SEO reporting tells you whether your investment in organic search is paying off. When used together, they give you a complete view of where your audience is coming from and how to attract more of the right people.
Frequently Asked Questions
Q: What is traffic analysis in digital marketing?
A: Traffic analysis in digital marketing is the process of collecting and interpreting data about how visitors find and interact with your website. It covers traffic sources, user behavior, engagement metrics, and conversions — helping you make smarter decisions about content, advertising, and SEO.
Q: How do I analyze website traffic for free?
A: You can do thorough traffic analysis completely for free using Google Analytics 4 and Google Search Console. GA4 tracks on-site behavior, traffic sources, and conversions. Google Search Console shows you keyword performance, impressions, and click-through rates from organic search.
Q: What are the most important traffic metrics to track?
A: The most important metrics are: sessions and users (volume), traffic by source (where visitors come from), bounce rate (engagement quality), conversion rate (business impact), top landing pages (content performance), and CTR from search (SEO effectiveness). Start with these before adding complexity.
Q: How often should I do traffic analysis?
A: For most businesses, monthly traffic analysis is the sweet spot it gives you enough data to spot meaningful trends without getting lost in daily noise. Add weekly check-ins during active campaigns and do a thorough quarterly review for strategic planning.
Q: What is a good amount of website traffic?
A: There is no universal benchmark it completely depends on your industry, business model, and goals. A B2B SaaS company converting 5% of 500 monthly visitors into enterprise clients can be far more successful than an e-commerce store with 50,000 visitors but a 0.1% conversion rate. Focus on traffic quality and conversion, not volume alone.
Q: What is the difference between sessions and users in GA4?
A: In GA4, a user is a unique individual who visits your site, while a session is a single visit. One user can have multiple sessions for example, if someone visits your site on Monday and again on Friday, that counts as one user but two sessions. Tracking both gives you a fuller picture of your audience size and engagement frequency.
Conclusion
Traffic analysis is not about drowning in dashboards and spreadsheets. At its core, it is about asking the right questions and finding clear answers in your data then using those answers to make better decisions.You do not need to track every metric or master every tool on day one. Start simple. Pick three to five metrics that directly connect to your business goals, check them consistently, and build your analysis practice from there. Over time, the patterns become obvious, the insights come faster, and the decisions get easier.
The websites that grow consistently are not the ones with the most traffic they are the ones run by people who understand their traffic. They know what is working, they double down on it, they fix what is broken, and they never stop paying attention. Now you have the framework to do the same. Open your analytics, start with the basics, and let the data guide you.